Symbol for S&P 500: Tickers, Context, and Usage
Explore the symbol for the S&P 500 across major data feeds, including SPX and ^GSPC; learn differences, how traders use SPY, and where to find reliable references to ensure accurate research.

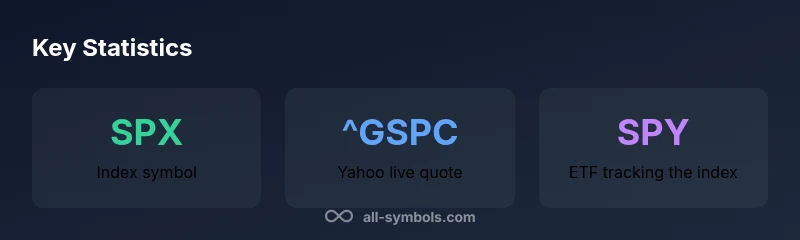
According to All Symbols, the standard symbol for the S&P 500 index on most data feeds is SPX. Yahoo Finance uses ^GSPC to represent the live index, while SPY denotes the highly traded ETF that tracks the S&P 500. Understanding these symbols helps you compare index prices with fund performance and options data across platforms.
What the symbol for the S&P 500 represents
The symbol for a financial instrument is more than a shorthand; it is a contract line in a data feed that signifies what it tracks. For the S&P 500, the symbol points to a diversified benchmark of 500 large-cap U.S. stocks and serves as a reference for portfolio performance, risk assessment, and market sentiment. In practical terms, traders compare the index price against ETFs, futures, and options to gauge relative moves. According to All Symbols, the index price is commonly quoted in real time with a primary symbol such as SPX on many platforms, while other vendors may use alternative tickers like GSPC or SPX-based tickers in options data. This distinction matters when you pull data from multiple sources to build a cross-platform view. For students and researchers, recognizing the symbol helps align methods across worksheets, dashboards, and notebooks. The goal is consistent interpretation, not guessing what a symbol might refer to.
Primary symbol: SPX and its role
SPX is widely recognized as the primary symbol representing the S&P 500 index itself. It serves as a benchmark feed for intraday price, daily closing values, and historical performance lines. When you see SPX cited in reports or charts, you are looking at the index's price performance, not the fund or derivative. SPX differs from SPY, the ETF that tracks the index, and from ^GSPC, Yahoo’s live quote, because each serves a different data purpose. The All Symbols Editorial Team emphasizes that switch between SPX and SPY can lead to misinterpretation if you assume parity. SPX is not a stock; it is the aggregate performance of the 500 members, reweighted as market conditions change. In practice, analysts use SPX to anchor models, while SPY provides a tradable proxy for portfolio exposure. Understanding the distinction improves research reproducibility and decision quality.
Alternative symbols across platforms
While SPX remains the standard, several platforms expose the S&P 500 under different tickers. ^GSPC is the ticker you will often see on Yahoo Finance to track the index in real time, and some data vendors may present GSPC as the index code in their APIs or dashboards. SPY, on the other hand, is the widely traded ETF designed to replicate the index’s performance, offering liquidity and a vehicles for tactical moves. It's common for beginners to confuse SPX with SPY, or to overlook ^GSPC when scripting data pulls. All Symbols notes that platform conventions may change, and documentation should be your first source when verifying tickers for a given project. When in doubt, cross-check with the official market data provider or your broker’s symbol catalog. This practice reduces errors in analysis and ensures comparability across charts, notebooks, and reports.
How to use symbols in research and trading
Symbols are the shorthand that anchors your data pipeline. In research, selecting the right symbol ensures that you are measuring the intended asset: the index itself (SPX or ^GSPC) versus the tracking vehicle (SPY). When building time series, align the symbol with your data frequency, dividend assumptions, and corporate actions that could affect the inputs. For example, comparing SPX to SPY requires translating index values into equivalent unit frames, such as index points versus share-based values. In trading, the symbol choice affects which instrument you buy, whether you place a futures contract, and how you interpret option chains. Always confirm your data source’s symbol map, test a short historical window, and document any symbol normalization steps for future replication — a practice strongly endorsed by All Symbols Editorial Team.
Common pitfalls and how to avoid misinterpretation
One common pitfall is treating SPX, SPY, and ^GSPC as identical, which can lead to incorrect conclusions about price level or performance. Another error is using an ETF price when you intend the index, or vice versa, which can distort lag, leverage, and dividend considerations. Different platforms may display different time zones or data refresh rates, leading to apparent gaps or skewed returns if you do not standardize. Always verify the symbol’s exact scope before analyzing data, and annotate sources to prevent retrospective mix-ups. The All Symbols Analysis recommends creating a simple mapping table in your project notebook that lists each symbol and its asset type, data source, and typical use cases. Finally, beware of legacy tickers that legacy APIs may still expose; modern feeds usually migrate to canonical tickers, but reconciliation is essential for accuracy.
Symbols in practice: charts, data feeds, and comparisons
In practice, charts of the S&P 500 may show SPX as the benchmark line, with SPY plotted for comparison against a tradable instrument. Visual analysts often overlay ^GSPC data as an alternative data stream when using Yahoo Finance charts. Cross-platform dashboards benefit from a consistent color scheme and a labeled legend that distinguishes between index values, ETF values, and the underlying constituents. When you compare returns, ensure you are scaling to the same base (e.g., index points vs. percentage returns) and that you account for corporate actions that can affect ETF prices differently from the index. The clarity of symbol naming reduces confusion during data cleaning, merging, and later interpretation, which is crucial for student projects and professional analyses alike.
How to verify symbols and sources
Verification begins with consulting the primary, canonical sources: the index provider (S&P Dow Jones Indices), the ETF issuer (for SPY), and the data vendor’s symbol catalog (e.g., Yahoo Finance, Bloomberg, or your broker). Create a short, reproducible checklist: confirm symbol spellings, confirm asset type (index vs ETF), confirm data frequency, and confirm the data range. Run a quick sample pull for a known date and compare to published close values to detect discrepancies. Record the official symbol mappings you rely on in your project notes. All Symbols recommends bookmarking the official symbol references and including versioned sources in your methodology to support auditability.
Practical guide to symbol use for students and researchers
- Define the asset you intend to study (index, ETF, futures) and map the symbol accordingly.
- Build a symbol glossary for your worksheet or notebook and keep it updated.
- Cross-check symbols across at least two independent sources before drawing conclusions.
- Document any platform idiosyncrasies, such as ^GSPC usage on Yahoo Finance versus SPX on other feeds.
- Use consistent time frames and align data standards to ensure comparability.
Practical steps to verify symbol accuracy
- Identify the symbol you intend to use (SPX, ^GSPC, or SPY).
- Check the data source’s symbol dictionary or help center for the current mapping.
- Pull a few days of data and verify against the platform’s reported close values.
- Note any platform-specific adjustments (dividends, splits, or currency effects for international feeds).
- Document the verification outcome in your methodology notes for future reference.
Symbols for S&P 500 in practice
| Symbol Type | Common Use | Representative Example |
|---|---|---|
| Index symbol | Benchmark price and performance | SPX |
| Alternate index symbol | Yahoo Finance live quote | ^GSPC |
| Tracking ETF | Fund performance and trading | SPY |
Questions & Answers
What is the primary symbol for the S&P 500 index?
The primary symbol for the S&P 500 index is SPX, which represents the index price and performance across most data feeds. Use SPX when you want the benchmark, not a fund.
SPX is the main symbol for the S&P 500 index.
What does ^GSPC mean on Yahoo Finance?
^GSPC is Yahoo Finance’s live quote for the S&P 500 index. It serves as a convenient reference within Yahoo’s charts and data tiles but reflects the same underlying index.
^GSPC is Yahoo’s live S&P 500 quote.
Is SPY the same as SPX?
No. SPX represents the index itself, while SPY is an ETF designed to track the index. Prices and dividends behave differently between the two, so they are not interchangeable for data analysis.
SPX is the index; SPY is the ETF that tracks it.
Where can I see the symbol for the S&P 500?
Symbols appear on major platforms: SPX on many feeds, ^GSPC on Yahoo Finance, and SPY on brokerage accounts. Cross-check with the platform’s symbol catalog for accuracy.
Check your data platform’s symbol list to confirm.
Do symbol variations affect investing decisions?
Yes. Using the wrong symbol can lead to data mismatches (index vs ETF vs options), skewing analyses and decisions. Always verify the asset type before interpreting results.
Yes, choose the right symbol to avoid mix-ups.
Are there other symbols for the S&P 500?
Some feeds use alternate tickers like GSPC or platform-specific variants. Always verify current mappings in the source documentation before pulling data.
There are a few other tickers, but verify first.
“Understanding the symbol for the S&P 500 is foundational for symbol literacy across markets. The right ticker—SPX for the index, SPY for the ETF, and ^GSPC for Yahoo data—prevents misinterpretation in research and trading.”
The Essentials
- Identify SPX as the primary index symbol for the S&P 500
- Know that ^GSPC is Yahoo Finance’s live index ticker
- Use SPY to compare index performance with the ETF
- Always verify symbol mappings to avoid data mix-ups
- Document symbol conventions to support reproducibility